
Projects & Job Costing
The OneDashboard introduces reliable, highly accurate predictable forecasting. It consolidates all your revenue and cost sources mixed with your project plans to show you profitability and cash reserves into the future.
Steer Your Business by the Numbers
The power of the OneDashboard is that it automatically consolidates the data from staff doing their day-to-day work. Further, it points out the problems in various departments so you can identify and course correct issues in real time.
This tool revolutionizes how you manage and approach planning, removing the surprises that often take you off course. With the OneDashboard you’ll be able to steer your business by the numbers with confidence.
As a business owner, you don’t want to go look at five dashboards to figure out what’s wrong or what will work in the future. The OneDashboard gives you the whole picture—your projected P&L, in the language business owners respond to.
Plan with Confidence, Not Guesswork
The OneDashboard consolidates real operational data into a single forecasting view so you can:
Predictable Forecasting
Reliably forecast month-end results based on actual operational data, not spreadsheets or guesswork.
Complete Business Visibility
See your whole business consolidated—revenue, costs, labor, backlog, and pipeline—in one view.
Cash Flow Confidence
Focus on the three critical levers—AR, AP, and inventory—to change the dynamics of how you run your business.
What-If Scenario Planning
Include sales pipeline activity and create what-if scenarios for invaluable planning and longer-term forecasting.
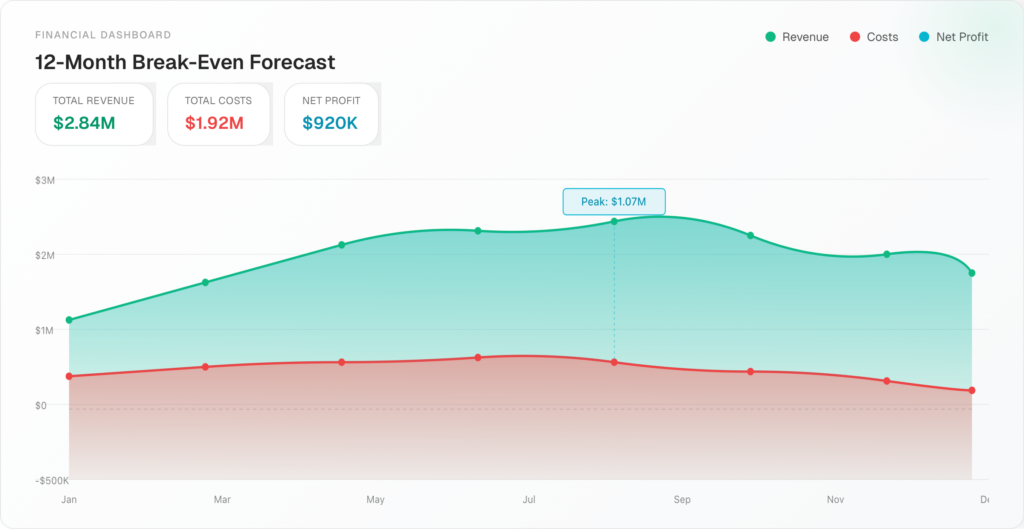
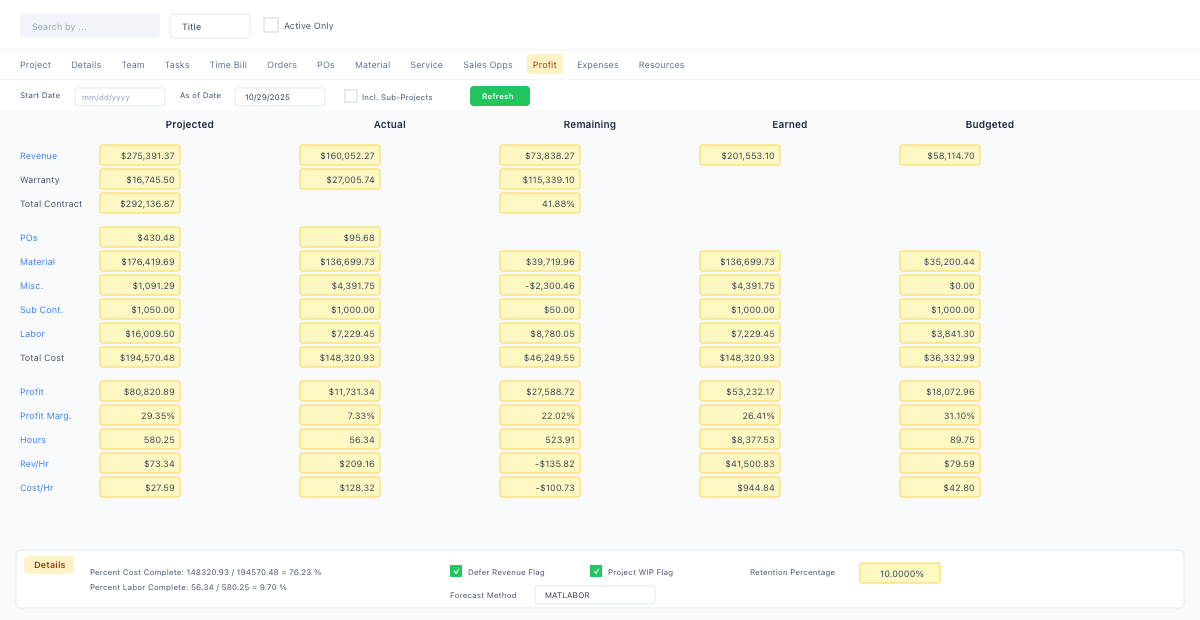
Project P&L Forecasting
The OneDashboard forecasts your project's P&L—the single financial statement that helps business owners plan. It takes all your data and creates a highly accurate picture of where your month is heading. This allows you to plan and shape your future instead of just reporting the past. When you can plan with confidence that your forecast will yield accurate results, you can sleep at night.
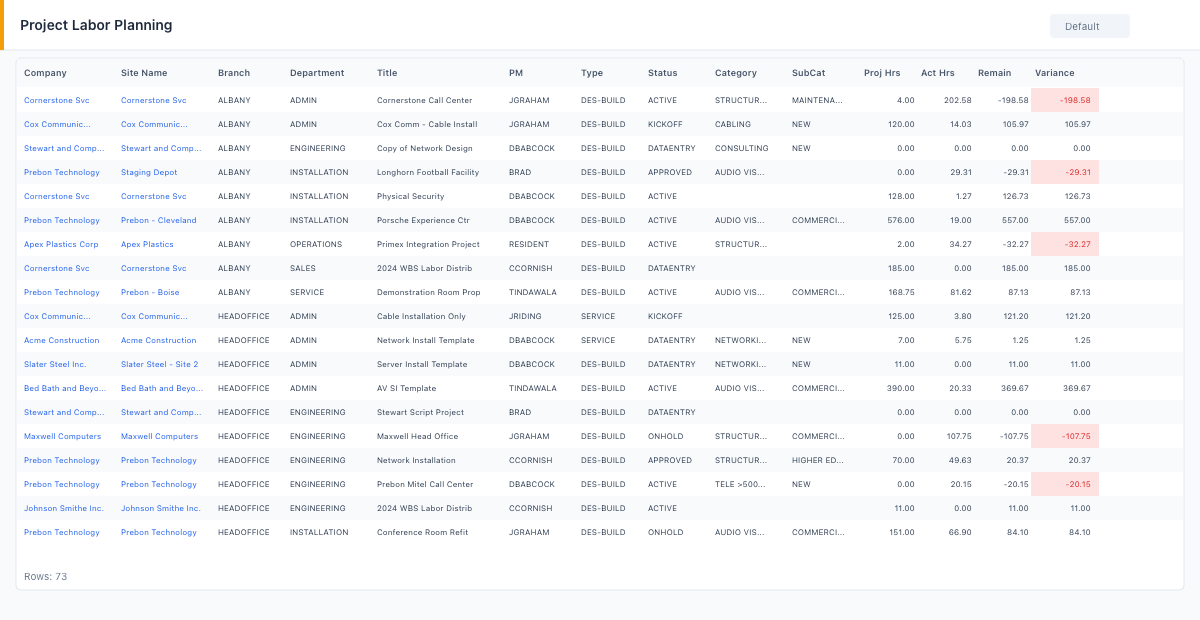
Labor Capacity Planning
See detailed labor requirements across jobs and compare that to your labor capacity, showing you over and underutilized labor by category going out up to two years. In the near-term, you see exactly what labor your projects need and what labor is available—allowing you to schedule effectively to maximize your profitability potential.
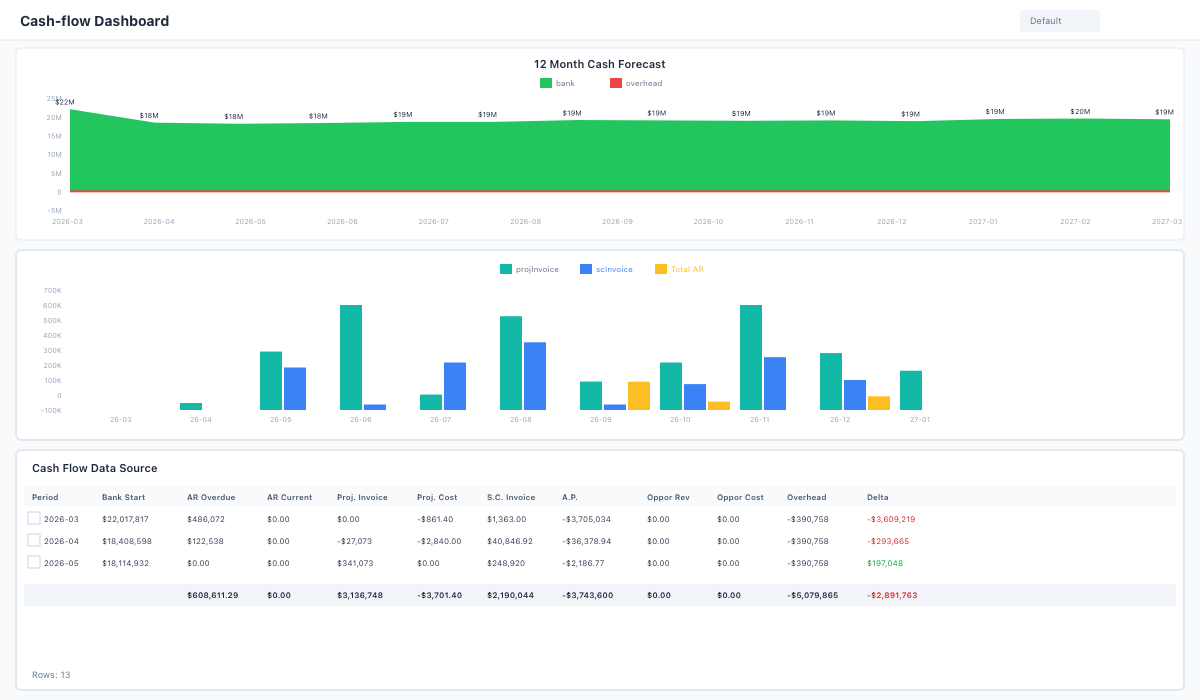
Cash Flow Forecasting
Factor in actual average paydays for customers rather than the due dates of invoices. Q360 provides great visibility into margins at every step of the project. With the various reports updated accurately, Q360 takes all the data and provides you with a very insightful and accurate Cash Flow Forecast to help with business decisions. Run what-if scenarios on reducing or increasing overhead.
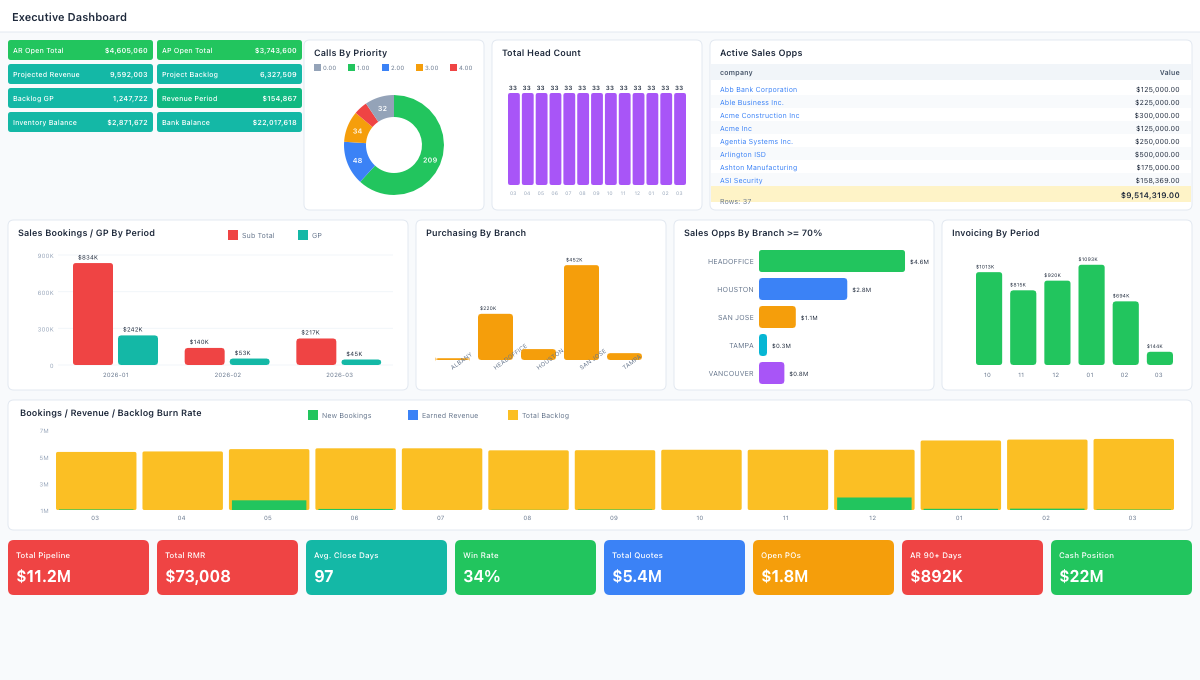
Executive View
Start with an executive dashboard showing how the whole company is performing, then cascade down to business units. Each manager from each functional area should have their own KPIs that lead up to the overall goals. When you take data and put it into visual perspective, you can consume and digest that information to make sense out of it. Dashboards and KPIs are essential tools for translating raw data into actionable insights.
Run Your Business Instead of Being Run by It
The OneDashboard gives your entire leadership team complete visibility. Know what you're going to be doing in the next 30 days, know you have the cash to fund it, and plan based on the future instead of reacting and firefighting.